Prepare Data for Visualisations
Page Topics:
To prepare a data model to be used to build charts and dashboards, you need to define business-friendly tables called Insights tables. They are designed to provide packaged data sources to business users.
The insight table needs two steps:
- Define the insights table
- Expose it to the visualisation environment.
Defining Insights Tables
Insights tables are designed to provide packaged data sources to business users. They are refreshed every day and are used to create dashboards that stay up to date as new data comes into the lake.
Generally, Data Analysts will define insights tables and will ensure that they are easy to use and intuitive.
To make insights tables most useful and optimal, the following principles should be followed:
Defined as a SQL query
The insights tables are the result of any SQL query.
While the tables can handle significant data loads, there are some limitations:
- The queries need to run within 30 minutes. Tables that take more than 30 minutes to generate will result in an error. Note that an error of this nature generally only happens under data volume or calculation loads, and points to an error in the SQL query (such as an unlimited join).
- Some scenarios result in the query resulting in an error due to calculation complexity. In this case, the query will need to be split up.
- You can use the sandbox schema to create temporary tables to test the SQL query. Use the "create table as" statement in the Sqllab.
The tables are generated each day at 3:00 AM GMT
The tables may be temporarily unavailable during this process.
Creating a table in sandbox
Here is the code for a query that creates a sandbox table people_extract from a lake table called people of the fictitious company Qainitech.
create table qainitech_sandbox.people_extract as
    (select name, surname from "qainitech-lake".people)
Priority Order
Insights tables can draw data from both the data lake and other insights tables. Each insights table is defined with a priority between 1 and 9. On the daily refresh, priority 1 tables are run first, and so on. This is useful for the structuring of insights tables - and allowing tables to be used in multiple lower priority tables.
Granularity
As mentioned, Insights tables generally don't require summarisation.
Deleted rows
As explained here, Comotion Dash does not allow for rows to be deleted. When defining insights tables, be sure to take into account what type of lake table you are selecting from.
Partitioning and Bucketing
Partitioning and Bucketing are a way of defining your table so that when a user runs a query, the data is organised in such a way that not all data needs to be scanned.
Partitioning
Partitioning is useful when the cardinality of a column of interest is low (where there are only a limited number of possible values for a column).
When to partition
- Categorical data such as a product column that has a limited number of possible product names.
- Queries that either uses this column to join or for filtering will have significant performance improvements and have a reduced cost per query.
Only one partitioning scheme is allowed per table - as it affects how the data is physically organised. It may be a good idea to have multiple insights tables for different use cases (even if the insights contain fairly similar data).
Insights tables can have a maximum of 100 partitions per table.
Partitions
Say you have the following insights table:
| id | Agent | Product | Date | Units |
|---|---|---|---|---|
| 1 | Ben | Widget | 1/10/2020 | 10 |
| 1 | Ben | Widget | 1/11/2020 | 13 |
| 1 | Ben | Widget | 1/12/2020 | 14 |
| 1 | William | Flange | 1/10/2020 | 10 |
| 1 | William | Widget | 1/10/2020 | 10 |
| 1 | William | Flange | 1/11/2020 | 12 |
| 2 | Tim | Fitting | 1/10/2020 | 13 |
| 2 | Tim | Flange | 1/10/2020 | 14 |
Partitioning by both Agent and Product will result in the following partitions:
Agent=Ben / Product=Widget
Agent=William / Product=Flange
Agent=William / Product=Widget
Agent=Tim / Product=Fitting
Agent=Tim / Product=Flange
The order of partitions also makes a difference in this example
If the Agent column is seldom used for filtering data, then this would be somewhat inefficient. The reason is that should the query limit by, say, product = Widget, the query would still need to look in all of the Agent partitions to find the data.
Bucketing
Bucketing is similar to partitioning, except for more continuous data. The table in question is split into a defined number of buckets based on the value of the target column, or a combination of columns. This allows for more efficient retrieval.
Know when to implement Bucketing
Bucketing is more appropriate where the column in question has a high amount of variation and not only a handful of possible values
Intuitive table and column names
Table names should be as intuitive and explanatory as possible, and meaningful to business users.
Similarly, column headings should be as intuitive as possible.
How to pick a good name for a table of new business transactions
The name should be new_business_transactions and not new_business
A column named flagged does not mean much to a user. A column with the name flagged_for_underwriting is more descriptive.
Format columns correctly
Using Presto SQL for the table definition, ensure that each column is the correct type. For example, dates should not be defined as strings, but rather parsed into date types. In your table definition SQL, if you are using a column in the source table that contains dates formatted as a string, you can use the date_parse function to parse it into a date.
Formatting of booleans
When creating boolean columns, using descriptive categories as opposed to true/false is encouraged. This is more friendly for building intuitive graphs. For instance, the case of the flagged_for_underwriting column mentioned above should be transformed into values
Null Handling
Nulls should be handled explicitly inside insights table definitions. This allows for a more intuitive presentation when creating dashboards.
For example
The coalesce function can be used to handle null values and defining them as some default; such as unknown."
Example of an Insights Table with all the fixings!
The following example selects from
- a snapshot style lake table called
peoplewith snapshot identifier ofsnapshot_id, and a date fieldbirthdateof string type defined in the ISO 8601 format - a row-level delta table called
petswith primary identifieridand change timestamp ofchangedDateand a boolean columndeletedthat indicates whether that row has been deleted
with people_filtered as (
    select * from (
        select *, row_number() OVER (PARTITION BY changedDate desc) as rn
        from
        people
    ) as temp
    where rn = 1 and not(deleted) -- select only the latest version of the line
),

with pets_filtered as (
        select *
        from
        pets
        where snapshot_id in (select snapshot_id from pets order by snapshot_id desc limit 1)
        -- select only the latest snapshot
)

select
    from_iso8601_date(birthdate) as birthdate,
            -- proper date typeing
    coalesce(title,'unknown') as title,
            -- null handling
    coalesce(try_cast(pets_filtered.paws as INTEGER),0) as paws,
            -- casting from string to integer with null handling,
    pets_filtered.breed_category,
            -- partitions must be the last columns in the table definition
    service_client_id
            -- service_client_id must always be the last partition
from
    people_filtered
left join
    pets_filtered
on people_filtered.id = pets_filtered.people_id
In this example, the partitioning scheme could be defined as
breed_category
service_client_id
birthdate Run Triggers
Run triggers serve as a condition that determines when specific queries need to be executed, thereby reducing the usage costs associated with unnecessary recalculation of insights tables.
Think of a 'Run Trigger` like a condition that decides when to run a specific query:
- If the condition returns a
Truevalue, it signals us to execute a particular action or query for that table. - If the condition is
False, we do not execute any instruction. - If there is no
Run Triggeris specified, and the action gets executed.
In simpler terms, Run triggers give us precise control over when to run tasks, making our data processing smarter and more efficient. They help us respond to specific events or conditions, ensuring that we do the right things at the right time. For more information, check out our technical blog post on optimizing insights tables with run triggers.
Talk to us
Once you have completed the final design, get in touch with your Comotion Representative and we will configure the insights table for you to run daily.
Please provide us with the following information
- Name
- SQL query defining the table
- Priority Order
- Description of the use case for the table
- Columns to partition by
- Columns to bucket by
- The number of buckets.
Exposing and Configuring Tables for the Visualisation Environment
Before using the tables in the dashboards, they should first be exposed in the visualisation schema.
The Comotion Dash frontend is based on Apache Superset and these instructions show how to set up the table so that it can be used in the Superset visualisation environment:
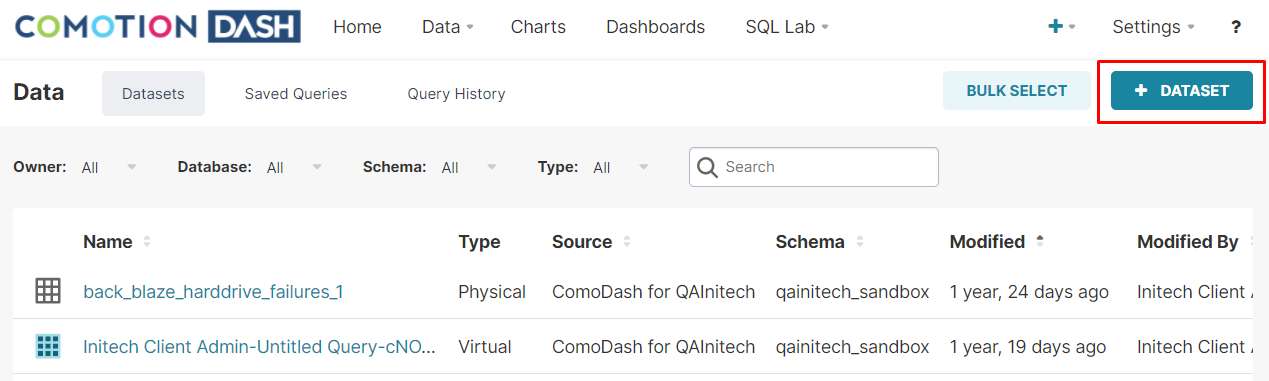
- To start, hover over the Data menu in the top navigation bar and select Datasets.

- Then click the top right Plus Dataset button.
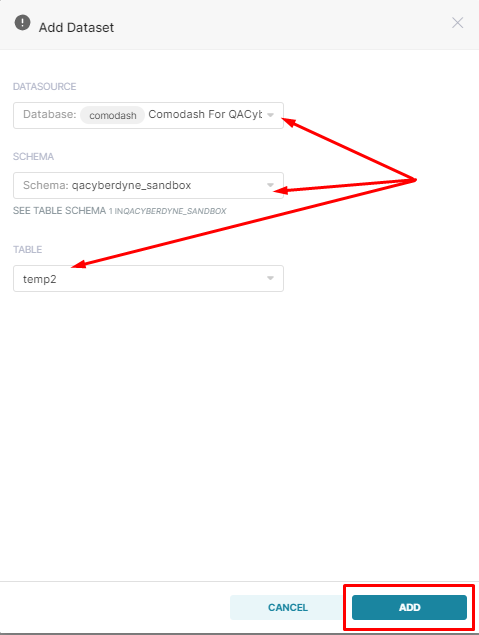
- Select your Data Source, Schema Name (which will either be your sandbox or insights schema), and Table name, click the Add button on the bottom right corner.
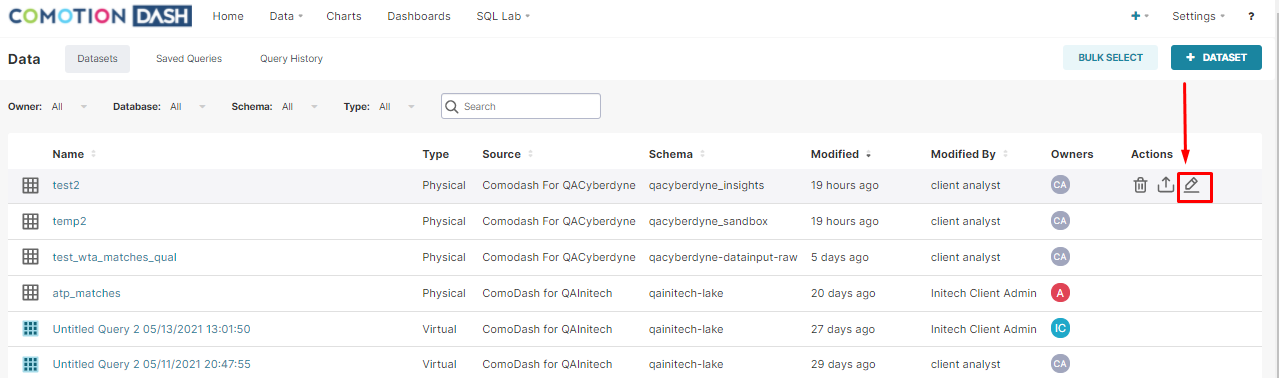
- Once created, navigate back to the table, and click the Edit button on the right side, in line with the new table.
- This page provides several options for configuring your newly created table. Note that these configuration options determine how this table can be used in graphing tools, without changing any of the underlying data."
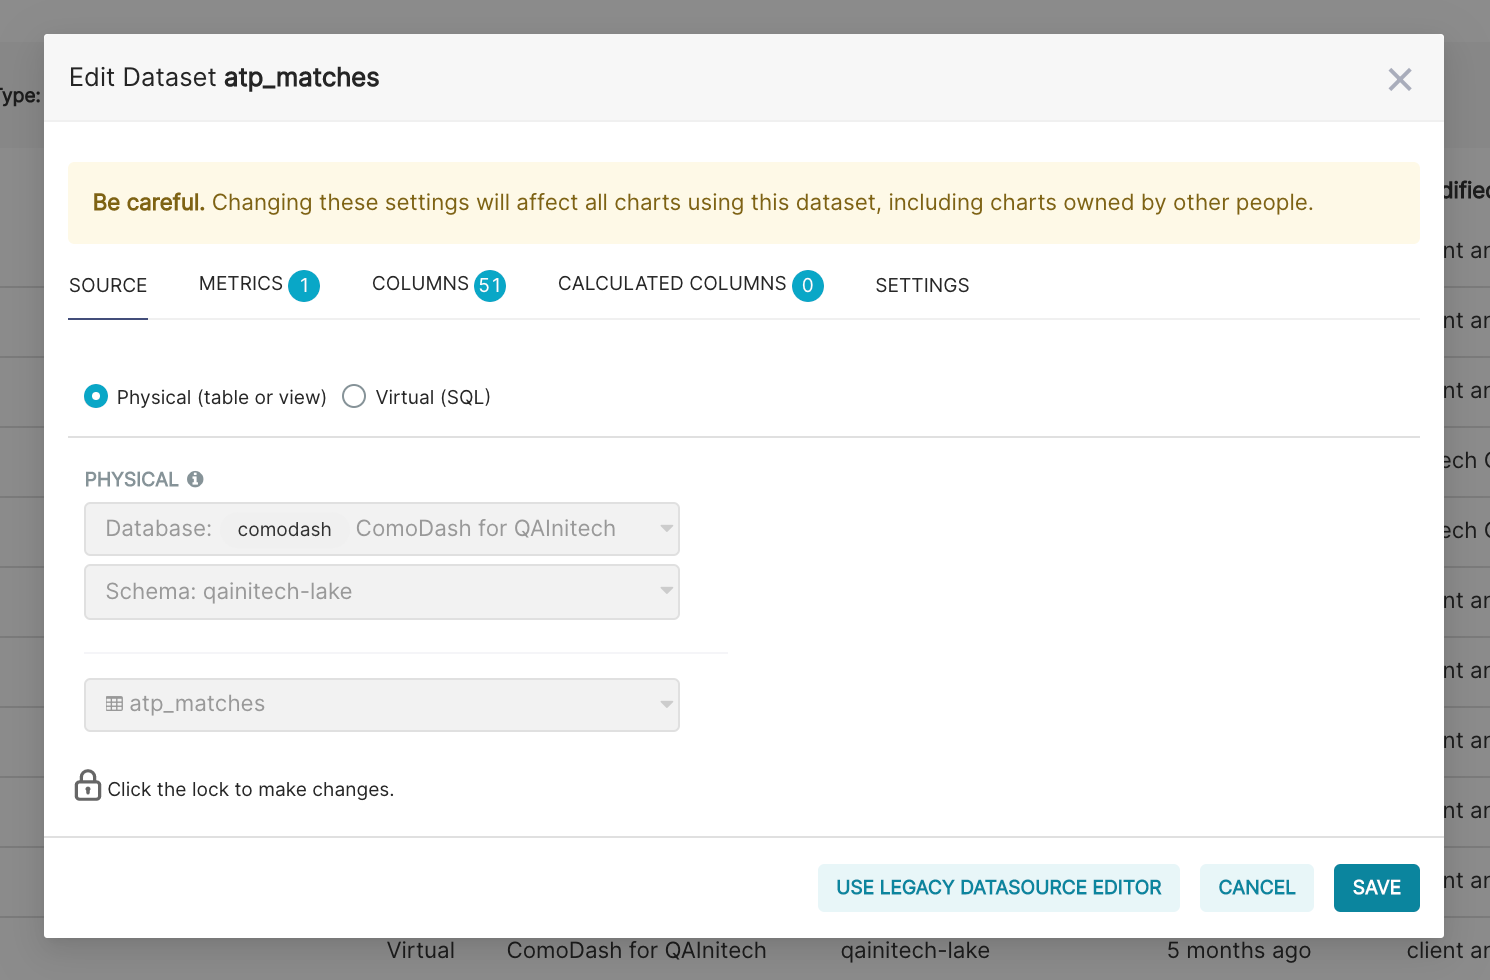
The configuration is split into five tabs:
| Tab | Details |
|---|---|
| Source | Location of the underlying table |
| Metrics | Define aggregated metrics |
| Columns | Column level configuration options |
| Calculated Columns | Define calculated, non-aggregated columns |
| Settings | Configuration options for the table |
The "Source" tab defines the location of the underlying table.
The dataset can either be based directly on an underlying insights or sandbox table, or on a sql query (otherwise known as a Virtual Table).
If physical table is selected, then you will have the option to select the table from the dropdown.
SQL
If Virtual Table option is selected, this can be used to define the table as a query, which is particularly useful for more advanced use cases like row-level security.
The "Metrics" tab allows you to define set aggregated metrics that will be made available in the front end.
Note that simple aggregated metrics, such as sum, average, etc, are available in chart builders by default, but more complex metrics, such as weighted averages, should be defined here. That way they will be available in the chart builder.
Metric
A unique name for the metric
Description
The description is available when you mouse over the metric in the chart builder. This is a useful way to document the metric, and indicate how it should be used.
Label
A user-friendly name for the metric. This name shows up in chart builder and ensures a good user experience for business users building charts.
Type
The data type of the column. For columns that are not calculated, this will be inferred from the underlying tables automatically. For calculated columns, this will need to be specified depending on the expression. The options include VARCHAR, BIGINT, FLOAT, TIMESTAMP.
SQL Expression
This defines how the metric is calculated. It should be a valid, aggregating Presto SQL expression.
Weighted Average Metric
An example of a defined metric is one which calculates an average of (say) price, weighted by (say) units_sold
sum(price * units_sold) / sum(units_sold)
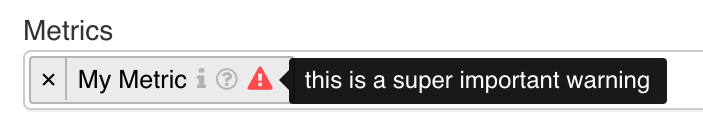
Warning Message Default URL
Default URL to redirect to when accessing from the dataset list page. This can be used to set a default chart for the dataset. This is a warning message that shows up as follows in the chart builder and allows you to alert the user to any limitations of using the metric. An example will be avoiding division-by-zero errors.
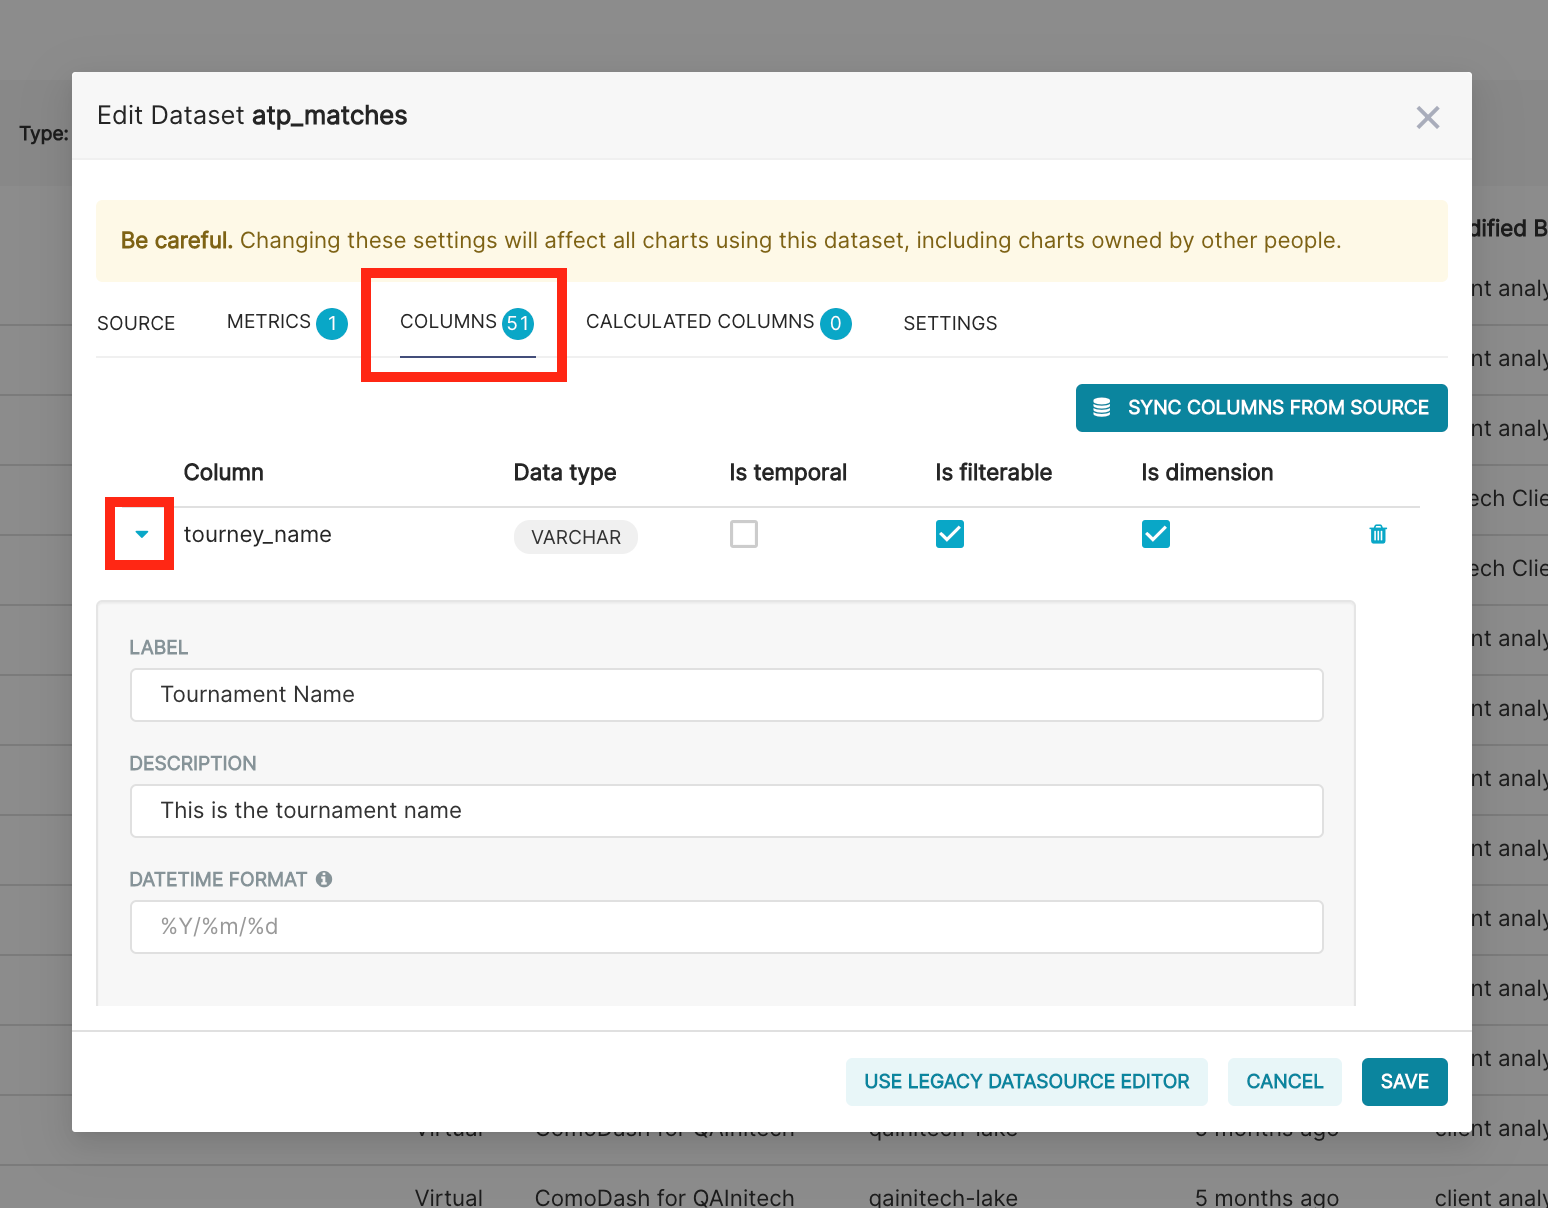
The "Columns" tab contains configuration for each column of the Insights or Sandbox table.
To configure a column, click on the expand button on the left side of the relevant column:
Label
A user-friendly name for the column. This name shows up in chart and dashboard builders and ensures a good user experience for business users building charts.
Description
The description is available when you mouse over the column in the chart builder. This is a useful way to document the column, and indicate how it should be used.
Is Temporal
Superset dashboards and chards support a few time-based features for temporal (or time-based) columns. These include automatically being able to set date intervals and time granularity for various visualisation types. If this is a TIMESTAMP column then enabling this will make those features available to the chart builder.
Is Filterable
Specifies whether the column can be used to "Filter" in charts.
Is Dimension
Specifies whether the column can be used to 'Group By' in charts. This should be checked for categorical type data that can be used as series or categories in charts.
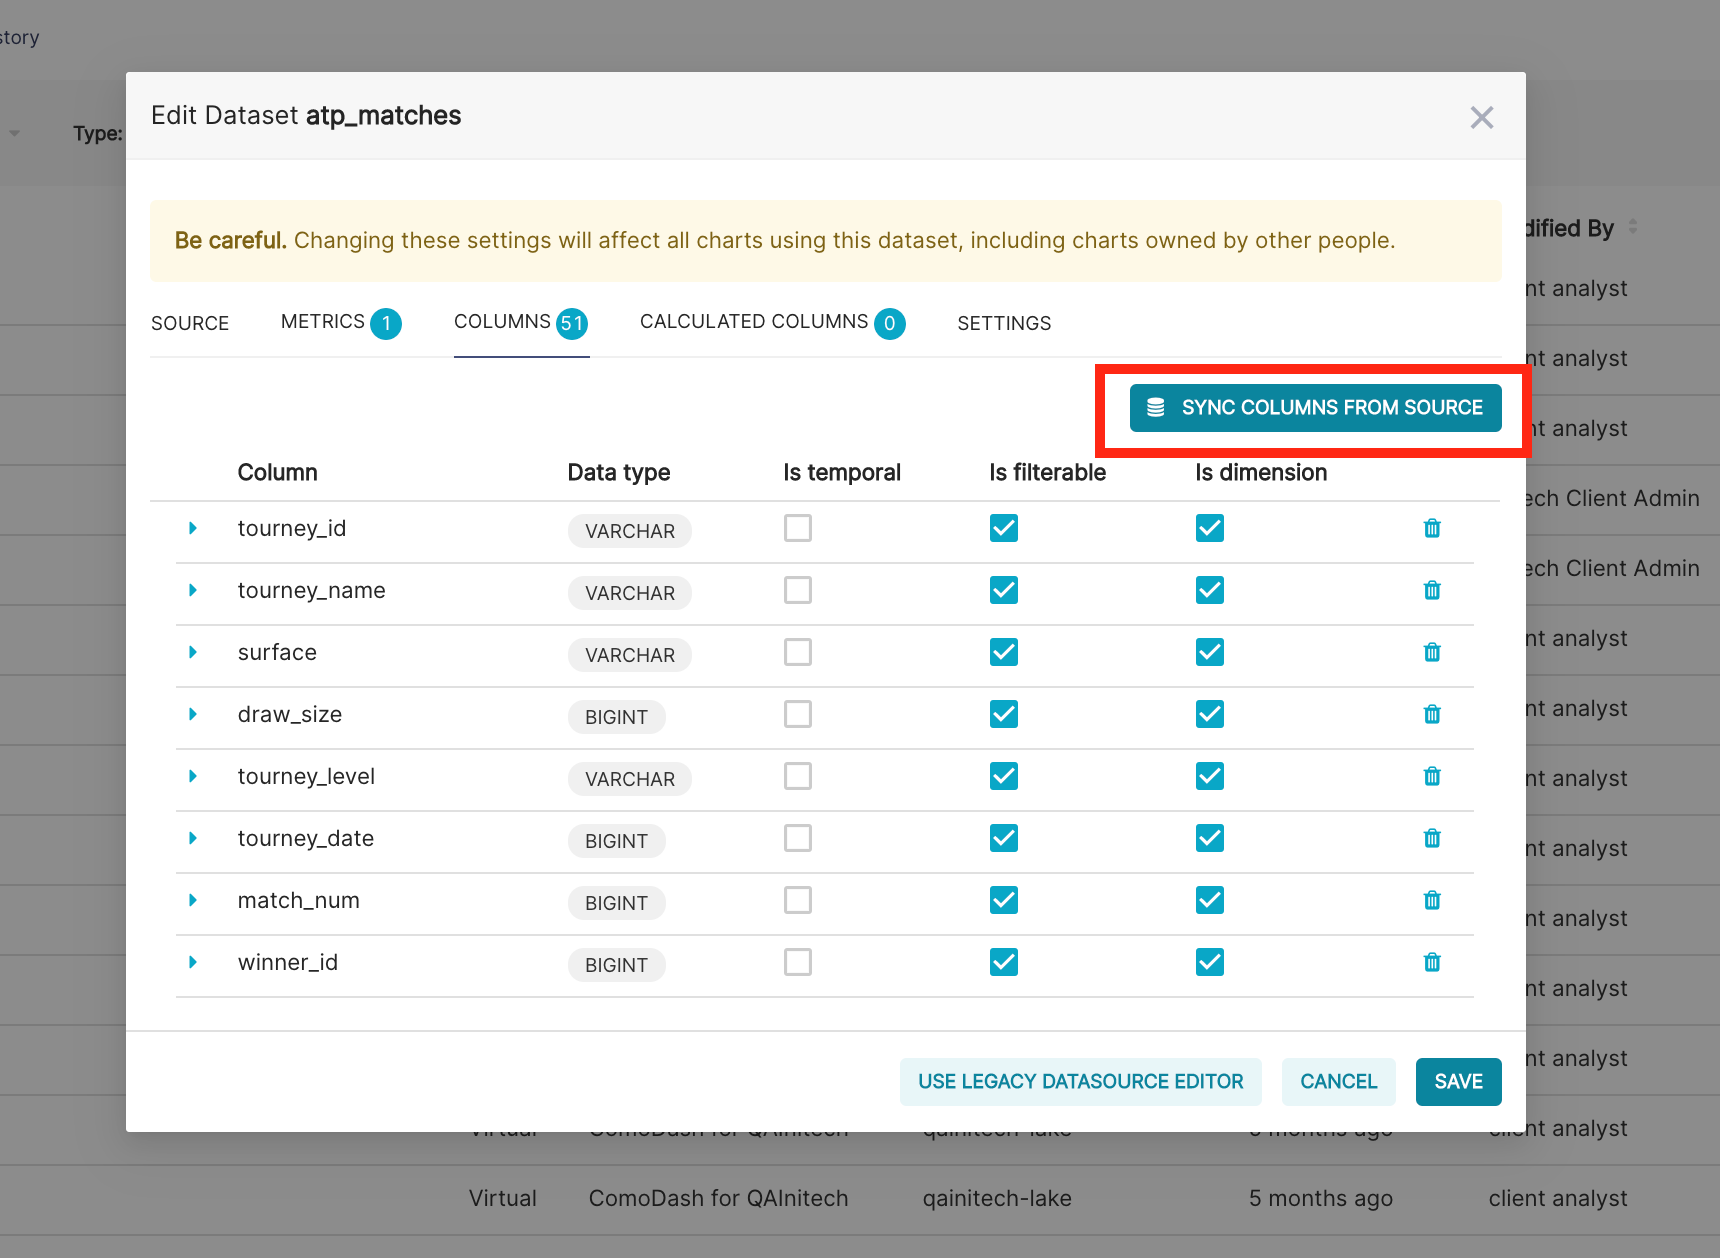
If you need to make changes to the underlying definition of an existing insights or sandbox table, you can update the Sync Columns from Source. This will update the column list to match the source table.
The "Calculated Columns" Tab allows you to create calculated (otherwise known as expression-defined) columns. These calculations are executed when users explore charts and dashboard. As far as possible, calculations should be done in the underlying table for performance reasons, but this is useful for things like age which depend on the current date
Column
The name of the column. This should be unique for the table.
Description
The description is available when you mouse over the column in the chart builder. This is a useful way to document the column, and indicate how it should be used.
SQL Expression
Defines how the column is calculated. It should be a valid, non-aggregating Presto SQL expression.
Data Type
The data type of the column. For calculated columns, this will need to be specified depending on the expression. The options include STRING, NUMERIC and DATETIME. Ensure that your sql expression returns the correct data type otherwise you may get errors in the chart builder.
Expression defined column for Initial and Surname
An example of an expression-defined column calculates an initial_and_surname column from first_name and surname columns.
substr(name, 1, 1) || ' ' || surname
The Settings tab outlines configuration for the table as a whole. Key configuration options are:
Description
Description of the table, which is useful documentation for future reference
Default URL
Default URL to redirect to when accessing from the dataset list page. This can be used to set a default chart and configuration for the dataset.
Autocomplete Filters
This influences how dashboard filters work. If enabled, a distinct list of values will be fetched from the table for the field being filtered in the chart builder.
Owners
Owners of the table have access to modify these settings
Offset
Timezone offset to be applied automatically to DateTime columns. This is useful when needing to modify the timezone of a table.
Cache Timeout
All query results are cached, for rapid repeated recall. This improves efficiency (as cached results can be shown much quicker) but can result in out-of-date data being shown in visualisations. The Caching timeout defines how long those query By default, this is set at 2 hours across Dash. However, you can modify the length here for this specific table. For Insights tables, Dash recalculates them once a day, so it is recommended not to modify this for Insights tables. However, for Sandbox tables, where recalculation takes place manually, there may be scenarios where it would be useful to change this setting.
Before you go
This documentation portal has been created to be your right hand of guidance on this journey. We will be evolving the content from time to time and if there is any specific information you want us to add to improve your experience, please get in touch or send us a direct email to dash@comotion.co.za.
We love hearing from you!