Comotion Dash Overview
Page Topics:
Here you will find information and examples on how to make the Comotion Dash work for you.
Comotion Dash Seminars
Checkout our Comotion Dash Seminars where we deep dive into:
Comotion Dash at First Glance
- One analytical data store for all your data.
- Securely share insights with colleagues and customers.
- Engage with large-scale data.
- Build dashboards and visualisations.
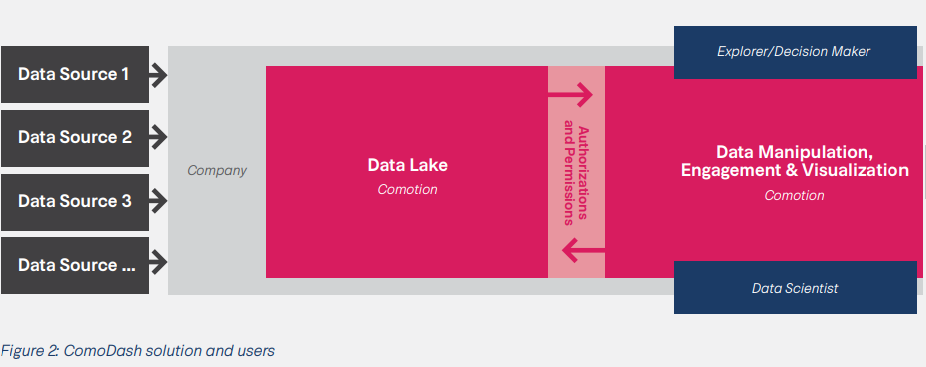
Comotion Dash is an all-in-one platform that combines a scalable, cloud-based data storage solution with compact visualization capabilities.
Comotion Dash combines a scalable data lake with a visualisation toolset and includes built-in security and sharing capabilities.
Comotion Dash uses Presto SQL as its primary language which allows data scientists and more advanced data users to perform complex data queries and operations directly against the data lake.
These insights can then be easily visualized and integrated into dashboards or insight publications.
Traditionally, data solutions that could deal with sufficient scale required multiple components, each one of which requires support and implementation. Comotion Dash seeks to solve this problem by providing a single integrated platform that serves the needs of both advanced analytics, and insight consumers.

User Roles and Permissions
Comotion Dash offers specific user roles with assigned permissions to allow user access as:
Data Admins
Admins can view and edit data tables, charts, and dashboards, even when they are not the owners.
- Have access to all dashboards and data sets.
- Can view and edit data table definitions and metadata, charts, and dashboards.
- Can change the ownerships of tables and dashboards.
- Can run queries directly on the whole underlying data model via SQL Lab.
Data Analysts
Analysts can create & edit data tables but cannot edit charts & dashboards or change ownership if they are not the owner.
- Can create, edit and view dashboards, charts, and data table definitions and metadata.
- Can view published dashboards and charts created by others
- Can run queries directly on the whole underlying data model via SQL Lab.
Data Consumers
Consumers have "read-only" permission which allows them to view published Dashboards with Insights and Sandbox Tables.
Consumers can only view a list of dashboards that are based on insights tables to which they have been given access and engage with those dashboards.
Key Components
Comotion Dash consists of several components:
Data Model
The data model is the underlying data engine and store of data. This consists of four parts, which are called schemas:
Data Input
Data is loaded into Comotion Dash as UTF-8 CSV or parquet files and first stored inside Data Input. The files are directly queriable which is useful, particularly on larger data loads.
Lake
The data lake is the main repository for data that is imported into the dash. Comotion Dash loads the new data from Data Input into the Lake where it is securely stored perpetually. This is done nightly in the v1 data model, and on upload in the v2 model. The Lake is where data analysts can run large-scale queries and interrogate data sets.
Data Model v2
Our blog post summarizes the main changes and documentation required to understand the differences between the v1 and v2 data model:
Insights
Insights schema holds tables that analysts have prepared for use in visualisations. They are stored in a format that is optimised for dashboards. These insight tables are generated and updated daily with the latest data that was pushed into the Lake.
Sandbox
Sandbox is the ideal spot for Data Analysts to use SQL queries to create tables for temporary dashboards. These tables are used for experimentation and exploration purposes.
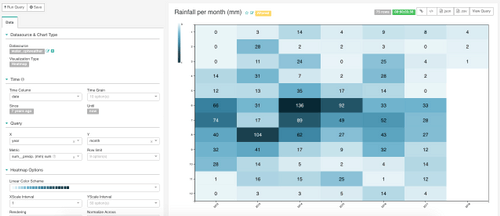
Charts and Dashboards
Comotion Dash enables visual data exploration, the building of rich dashboards based on Insights and Sandbox tables. You can select data to be displayed in either simple line charts or highly detailed geospatial charts.
The Comotion Dash frontend is based on Apache Superset
A modern data exploration and visualization platform. Designed to be fast, lightweight, intuitive, and includes options that make it easy for users of all skill sets to use.

SQL Lab
SQL Lab is used by Analysts to query any data source, including the metadata database. It is also used to create tables. You can read more about it on this page
Data Ingestion API
The Data Ingestion API pushes data into Comotion Dash, where it is safely stored to access, use and analyze. You can read more about it here
Comotion Dash Seminars
Building Insights Pipelines for Admins and Analysts
This is aimed at admins and analysts who would like to understand more about building insights pipelines.
The video will cover:
- An introduction and overview to building insights pipelines
- ComoDash Data workflow
- Schemas
- Insights space
Loading and Structuring Data for Admins and Analysts
This is aimed at admins and analysts who would like to understand more about best practices for loading and structuring data in Dash.
The video will cover:
- An introduction and overview to loading and structuring data
- Recap of workflow and schema structure
- Lake structuring strategies
- Python SDK
Building Visualizations for Business Users
This is aimed at business users who would like to understand more about building visualizations.
The video will cover:
- An introduction and overview to building visualizations
- Recap of workflow
- Visualizations
- Insights space recap

Before you go
This documentation portal has been created to be your right hand of guidance on this journey. We will be evolving the content from time to time and if there is any specific information you want us to add to improve your experience, please get in touch or send us a direct email to dash@comotion.co.za.
We love hearing from you!
Changing of Ownership
If you are an Admin and need to know how to change the ownership of a table or dashboard, you can access the pathway on this page.