Announcing New Comotion Dash Version
31 May 2021 [Updated 12 June 2021]
Improved Chart Builder, Refined Dashboard Builder, Better SQL Lab Display, and Much More!
Page Topics:

Introduction
We are excited to announce the availability of a new version of Apache Superset (Dash visualisation layer).
Keep a lookout for the new release on the weekend of the 11th of June 2021.
No downtime expected
While we don't expect downtime due to the nature of the upgrade, there is a risk that certain clients may experience a temporary outtage.
Here's whats new
- Improved Chart Builder
- Refined Dashboard Builder
- Better SQL Lab Display
Improved Chart Builder
Navigation Pane
With the new user-friendly navigation pane on the left, you can easily access the chart listing that sets aside reuseable metrics and columns. It also offers you the option to hide or display the navigation pane as needed.

Edit the data set
You now have the ability to edit the data set with
- Better labels
- A detailed description
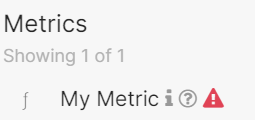
- A warning in the metrics sector
- The peron who has certified the metric
- The certification details
Once you hover over the icons next to your column title on the navigation pane, you will see the
- Description
- Metric
- Warning
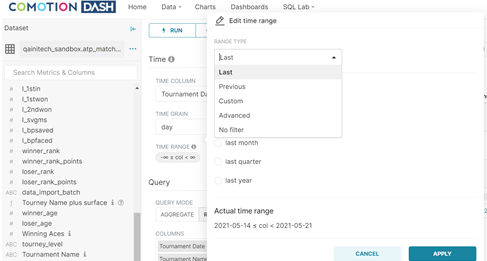
Time-range filter
The time range filter has been cleaned-up and organised better to offer you more control over chart results.
Refresh of some charts required
Due to the change in how time-ranges are structured, a refresh is required to ensure that time filters continue to function on some charts. If a time filter stops working, simply open the chart in chart builder and save it. This will make the required updates and restore the time filter function.
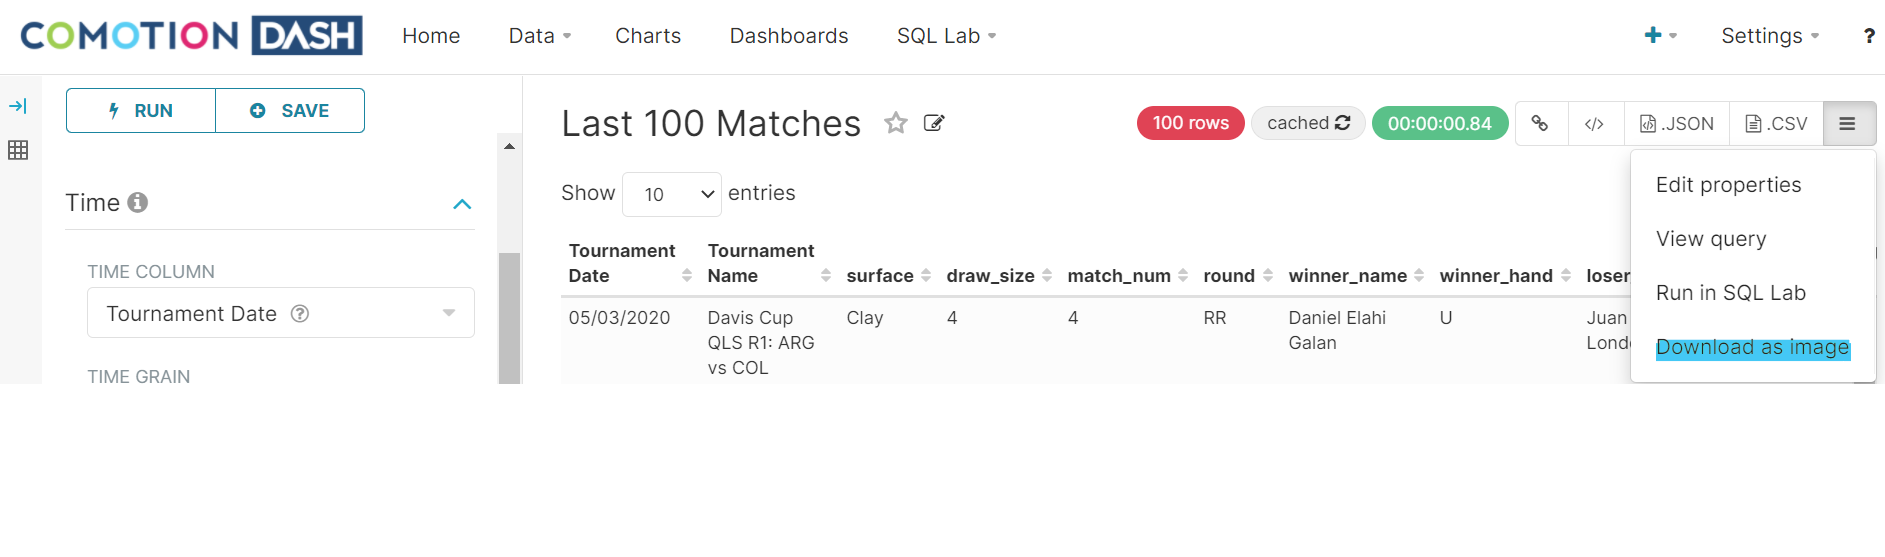
Exporting Charts
Exporting a chart is simple. Either export the chart using the exiting JSON file or CSV options or choose the new Download an Image option.
Time Series Chart
Jump into the chart builder functionality and play around with the freshly designed time series chart. The chart gives you more control and the option to show multiple views such as stacked area charts.

Refined Dashboard Builder
The dashboard builder has been refined to make it more user-friendly to set filter mapping, edit dashboard properties, and provides more options when it comes to exporting data.
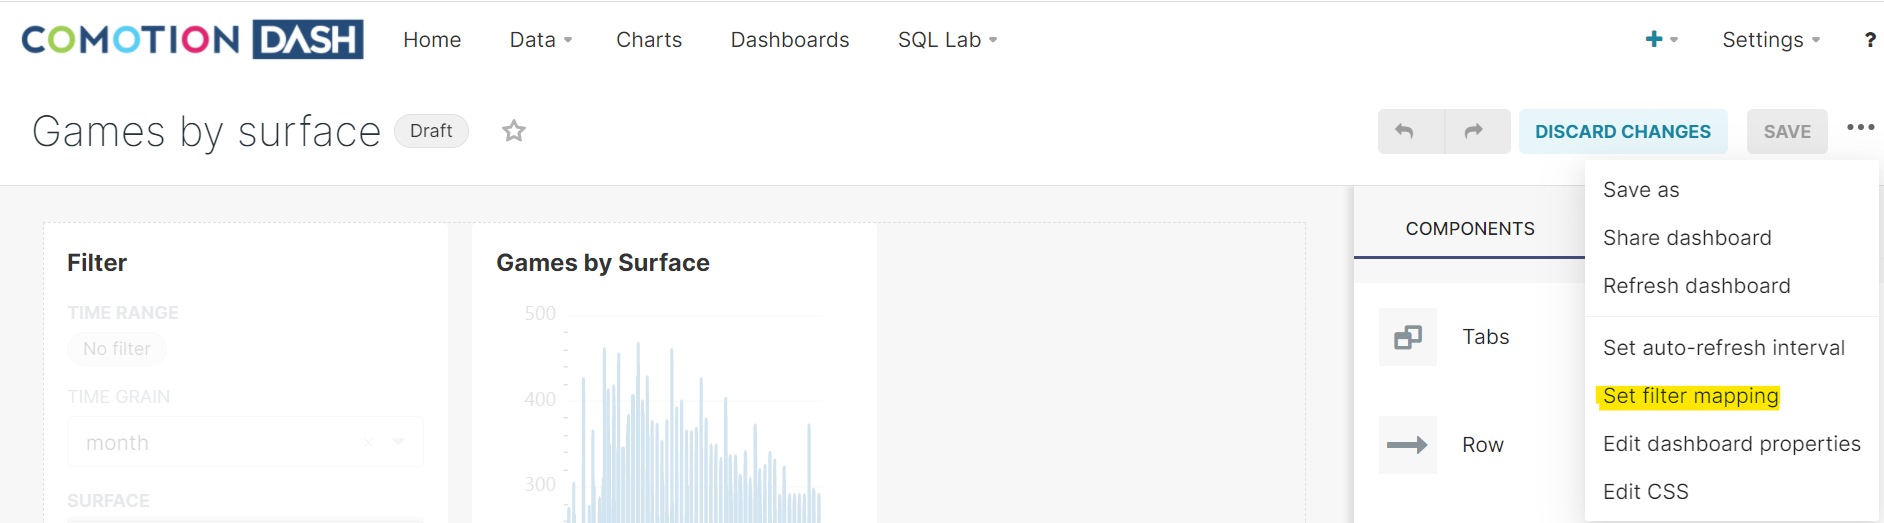
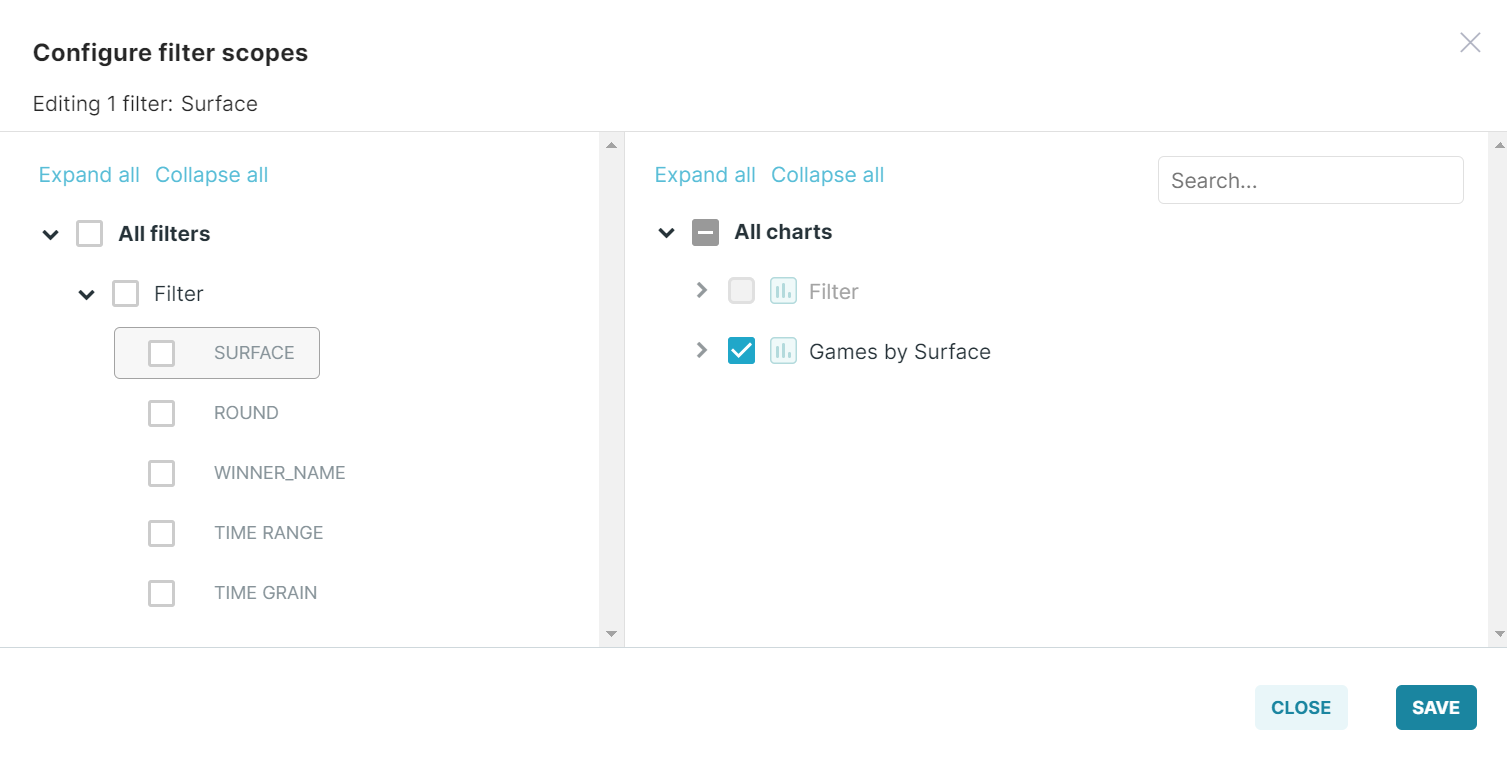
Filter Mapping
The filter mapping functionality allows you to choose one or more filters that can be applied to each chart on the dashboard view.
On the selected chart on the dashboard, you will see a filter icon with a number next to it. If you hover over this icon, it will indicate the number of filters applied to the chart and the number of filters that remain unset.
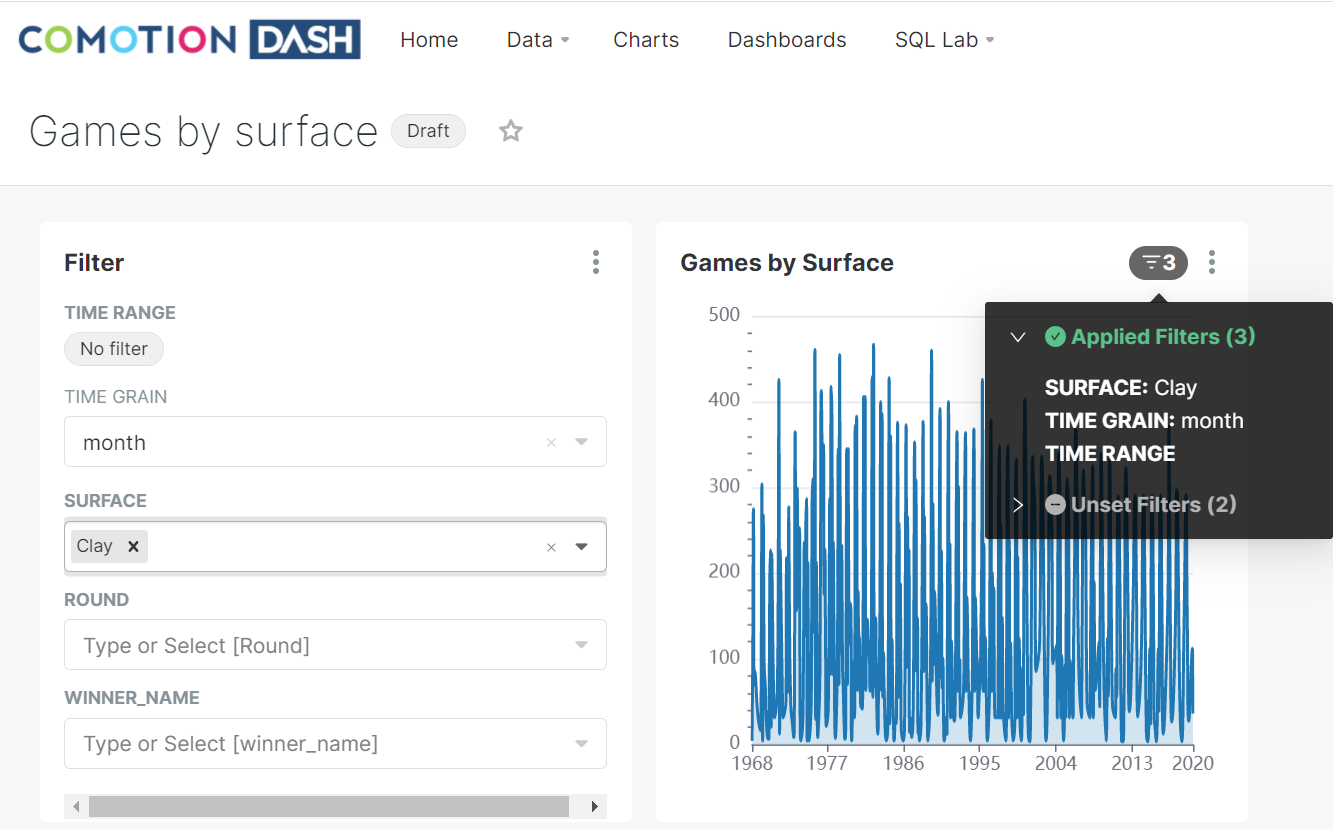
Next to the filter icon, you will see 3 dots above each other on the selected chart. It gives you the option to maximize and minimize the chart.
Incompatible Filters
A warning label has been introduced to highlight where filters are present on the dashboard but which are incompatible with individual charts. This will generally be where:
- a filter box and chart are present on the same dashboard but on different datasets
- the filtered column does not have an identically named column on the chart dataset
This can be remedied by applying appropriate filter mapping mentioned above.

Filter boxes and charts from different datasets
A filterbox can apply to charts on multiple datasets, as long as the datasets include columns with identical names to the columns being filtered on the filterbox.
Upcoming Deprecation Notice for Filter Boxes
If a user accesses a dashboard featuring an editable filter box, a pop-up message will appear stating:
'filter_box will be deprecated in a future version of Superset. Please replace filter_box with the dashboard filter component.'
However, there is currently resistance from the community against the deprecation of filter boxes, so no changes are required at this time.
Edit Dashboard Properties
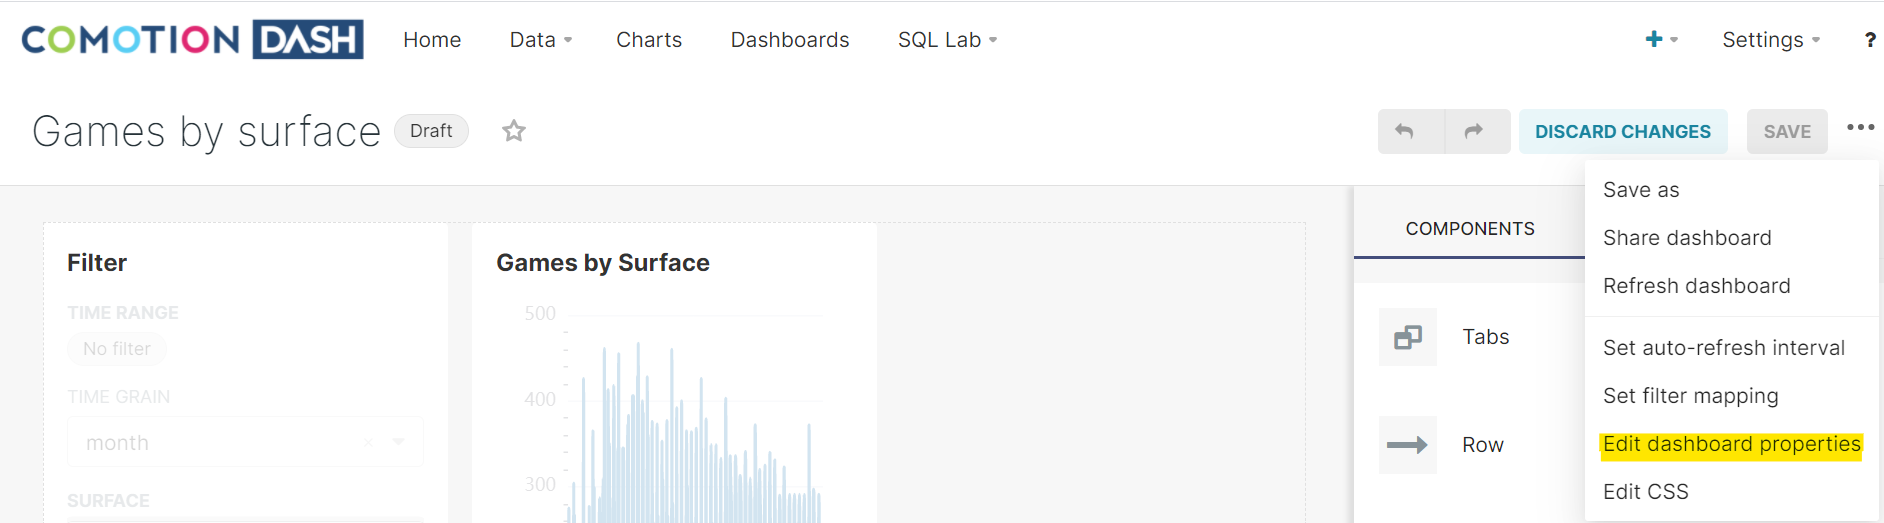
For a better user experience when working with the dashboard, we have enabled editing of basic dashboard information, such as:
- Title: The title of the dashboard
- URL Slug: The readable URL for your dashboard

- Access: The list of owners who can alter the dashboard.
- Colors: 13 different color scheme to apply to the dashboard.
Export Dashboard and Charts
Once the dashboard has been saved, you have the option to export the dashboard or chart via the existing CSV option or the new Download an image option.

Better SQL Lab Display
The SQL Lab editor, saved queries, and query history display has overall been improved.
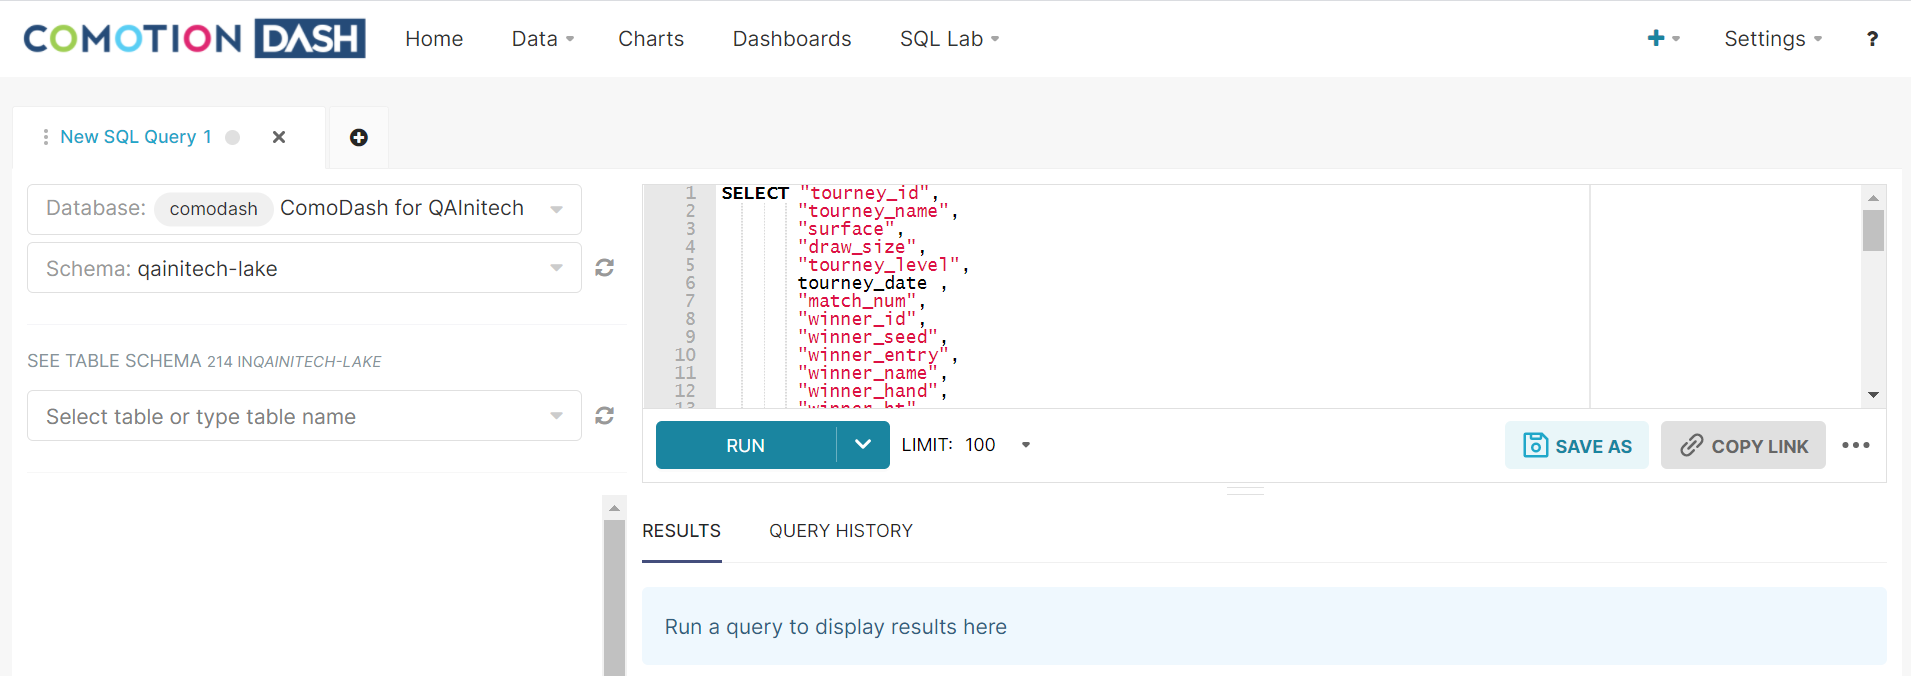
SQL Editor
The SQL editor allows you to run & save your SQL query based on the database and schema selection.

SQL Lab Memory Issues
Heavy use of SQL Lab has caused memory issues, this has been resolved. We have also improved the behaviour of the session expiry pop-up.
Saved Queries
The saved query section lists all your previous saved queries to easily refer back to or reuse as required.
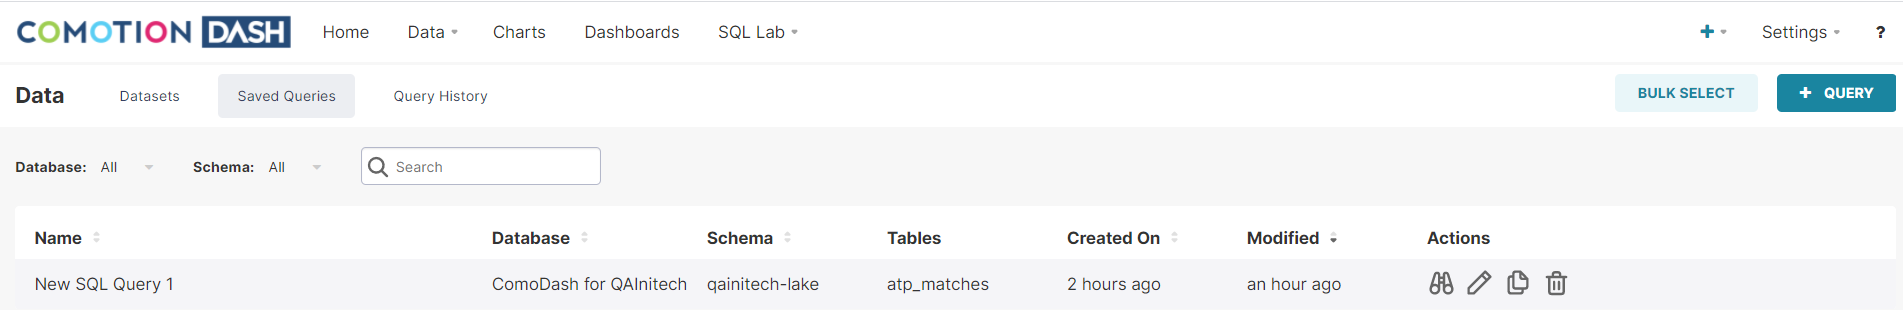
Once you hover over the specific query, you have the option on the right-hand side to:
- Preview your query
- Edit the query
- Copy & share the query
- Delete the query
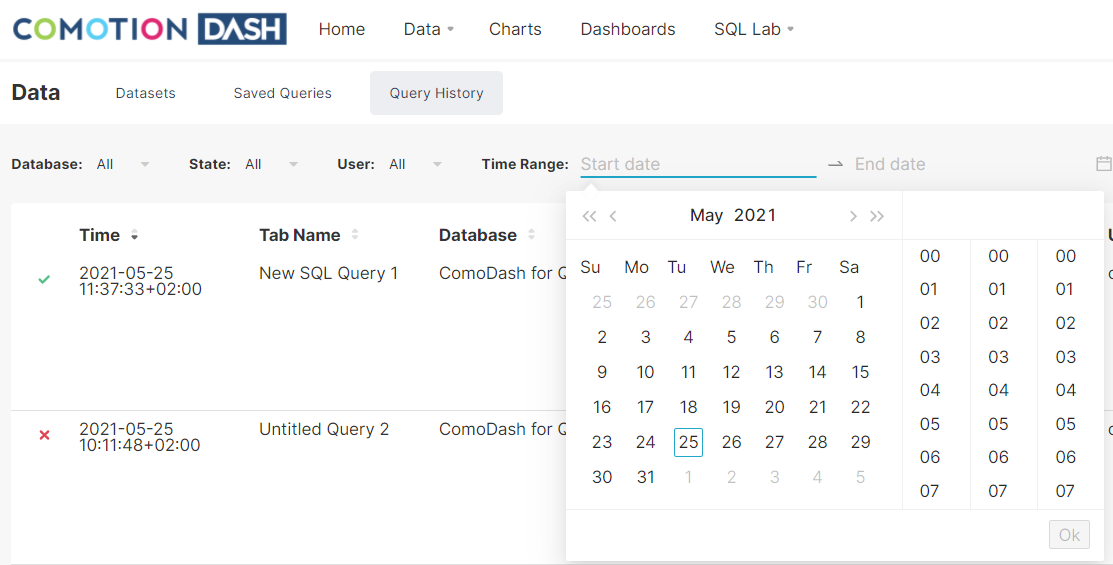
Query History Display
The query history shows all your queries run over time on the Comotion Dash platform.
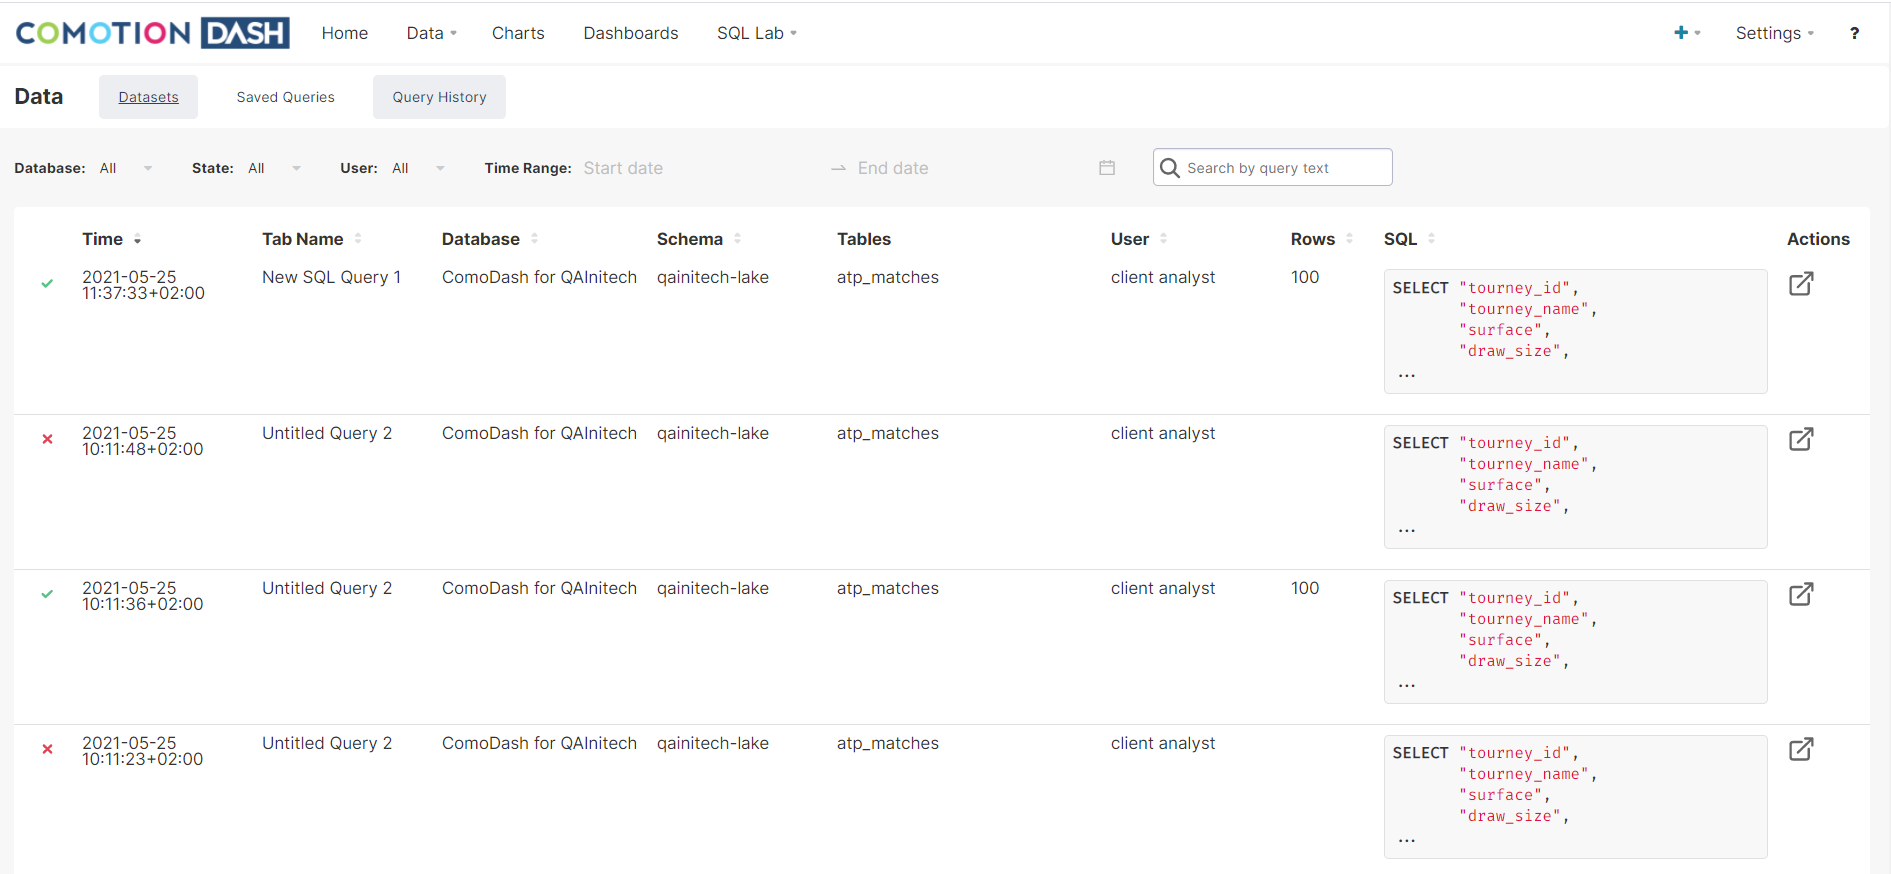
The time range is also more user-friendly when adding date and time to the search criteria.
Before you go
This documentation portal has been created to be your right hand of guidance on this journey. We will be evolving the content from time to time and if there is any specific information you want us to add to improve your experience, please get in touch or send us a direct email to dash@comotion.co.za.
We love hearing from you!
Get in touch
We are constantly working on improving your Comotion Dash experience. If there is any specific information you want us to add to improve your experience, please get in touch.